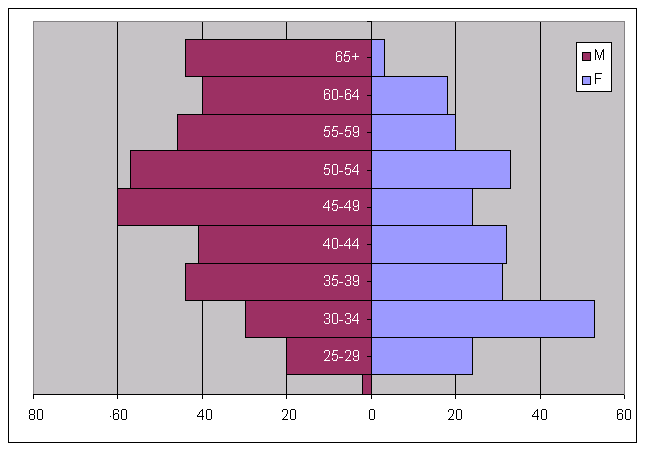
2 .
Language used to answer the questionnaire.
|
Language of questionnaires
|
Number
|
|
English
French
Spanish
Russian
Total
|
352
214
49
22
637
|
3.
Number of questionnaires receved by country of birth
(more
developed countries, less developed countries).
|
Country
LDC/MDC
|
Total
|
|
LDC
MDC
Total
|
141
496
637
|
(regions)
|
Regions
|
Total
|
|
Europe
North
America
Other
Total
|
355
134
148
637
|
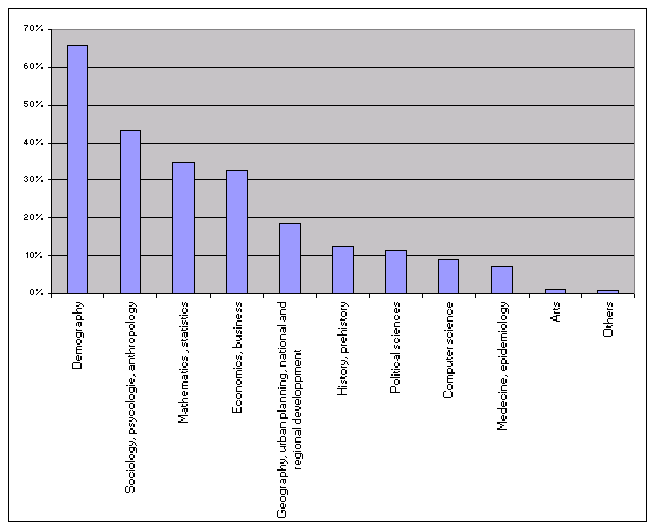
4.
Main academic discipline, (categories recoded) of training of respondents
(%, several answers possible)
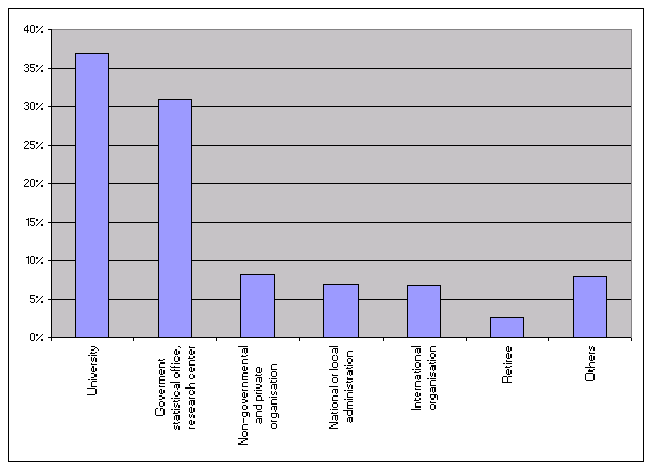
5. Organisations
in which the respondents are currently working
(%, several answers possible,
620 respondents).
6. Membership in scientific associations of respondents
(%, several answers possible, 527 respondents).
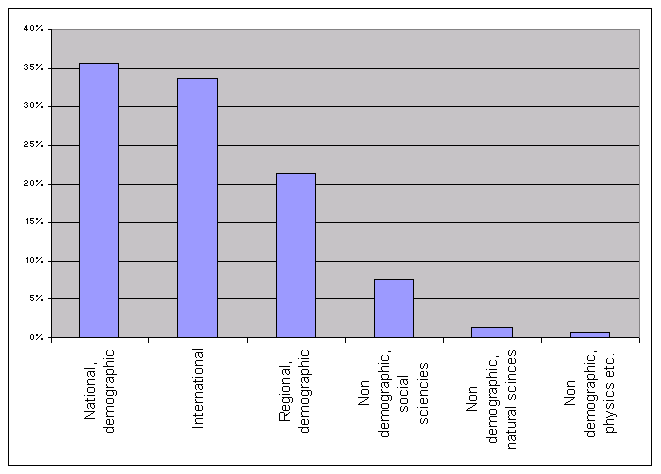
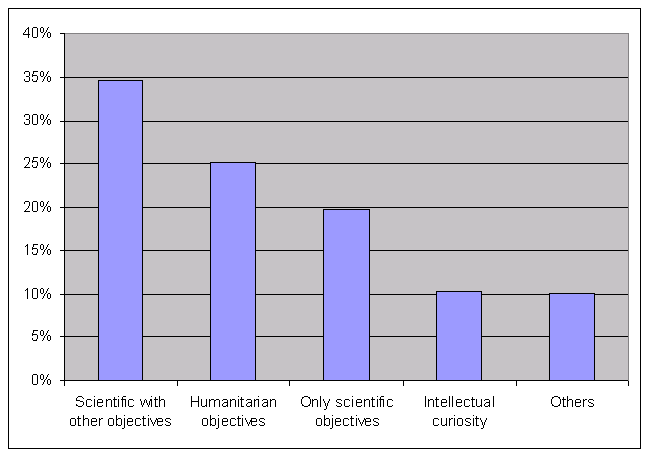
7.
Objectives
(categories recoded) which determine the commitment of respondents
to demography
(%,
several answers possible, 593 respondents)
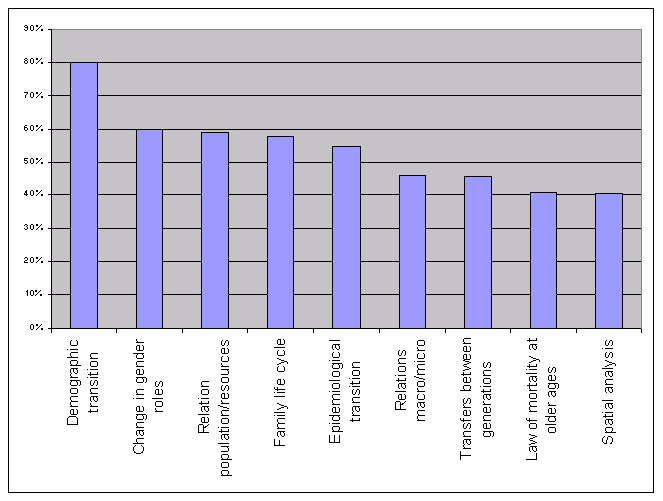
8.
Paradigms quoted by respondents as central to demography (%,
several answers possible, 575 respondents) .
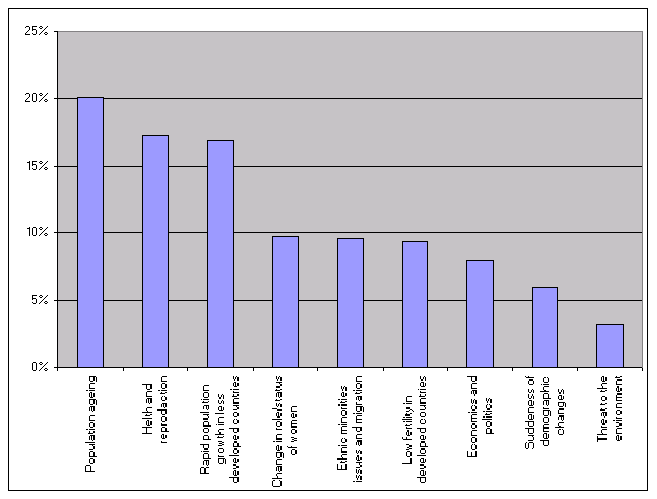
9.Phenomena
(categories recoded) quoted by respondents as having most influenced
demography (%, several answers possible, 543 respondents).
